Convert WHO z-scores/centiles to anthro measurements (generic)
Source:R/standard_who.R
who_centile2value.RdGet values of a specified measurement for a given WHO centile/z-score and growth standard pair (e.g. length vs. age) and sex over a specified grid
who_centile2value(x, p = 50, x_var = "agedays", y_var = "htcm",
  sex = "Female", data = NULL)

who_zscore2value(x, z = 0, y_var = "htcm", x_var = "agedays",
  sex = "Female", data = NULL)
Arguments
| x | vector specifying the values of x over which to provide the centiles for y |
|---|---|
| p | centile or vector of centiles at which to compute values (a number between 0 and 100 - 50 is median) |
| x_var | x variable name (typically "agedays") - see details |
| y_var | y variable name (typically "htcm" or "wtkg") that specifies which variable of values should be returned for the specified value of q - see details |
| sex | "Male" or "Female" |
| data | optional data frame that supplies any of the other variables provided to the function |
| z | z-score or vector of z-scores at which to compute values |
Details
for all supported pairings of y_var and x_var , type names(who_coefs)
See also
Examples
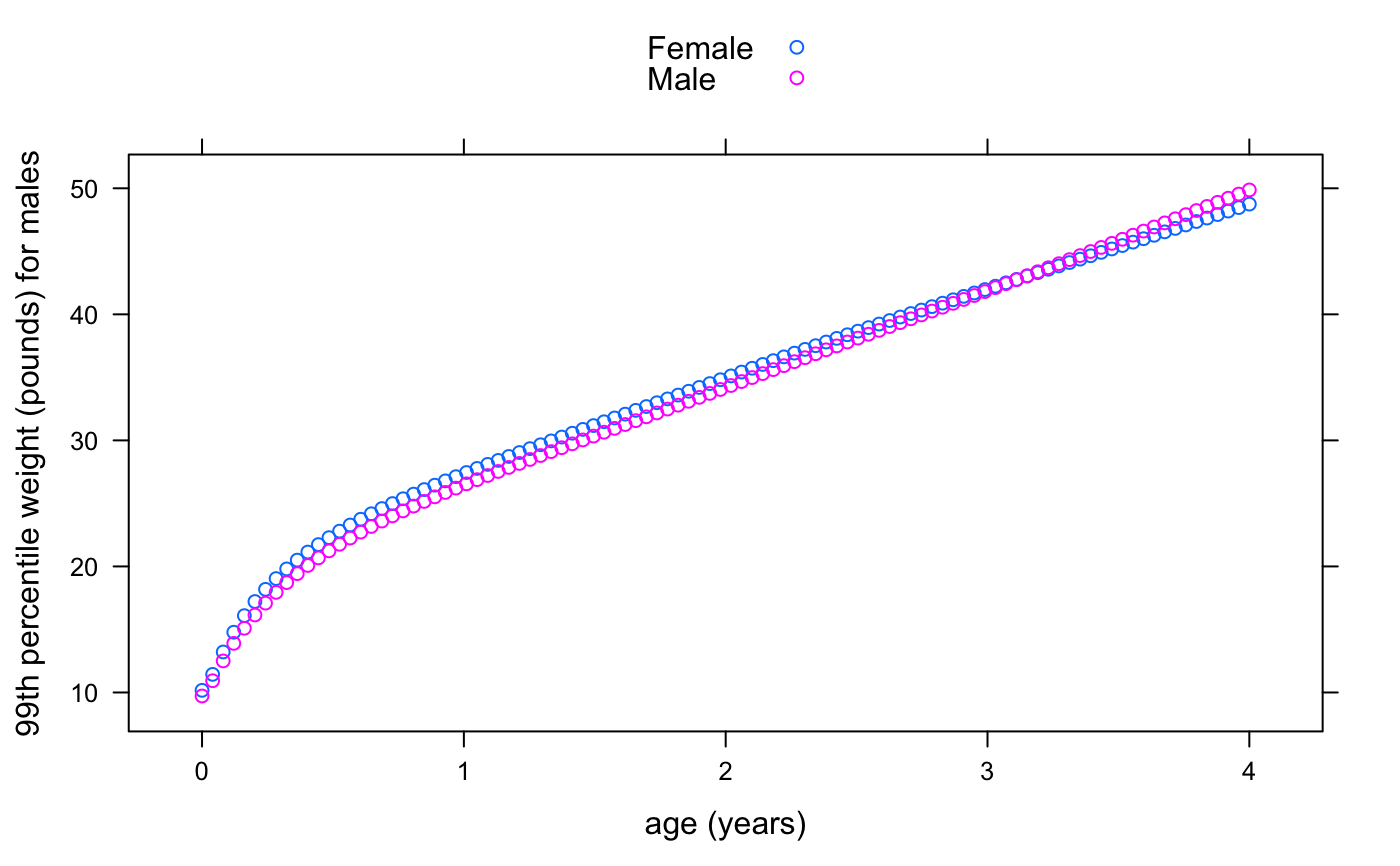
# median height vs. age for females x <- seq(0, 365, by = 7) med <- who_centile2value(x) plot(x, med, xlab = "age in days", ylab = "median female height (cm)")# 99th percentile of weight vs. age for males from age 0 to 1461 days dat <- data.frame(x = rep(seq(0, 1461, length = 100), 2), sex = rep(c("Male", "Female"), each = 100)) dat$p99 <- who_centile2value(x, p = 99, y_var = "wtkg", sex = sex, data = dat) lattice::xyplot(kg2lb(p99) ~ days2years(x), groups = sex, data = dat, ylab = "99th percentile weight (pounds) for males", xlab = "age (years)", auto.key = TRUE)

